- Home
- Sri Lanka’s Lost Decade: A Decade of Diverging Household Incomes
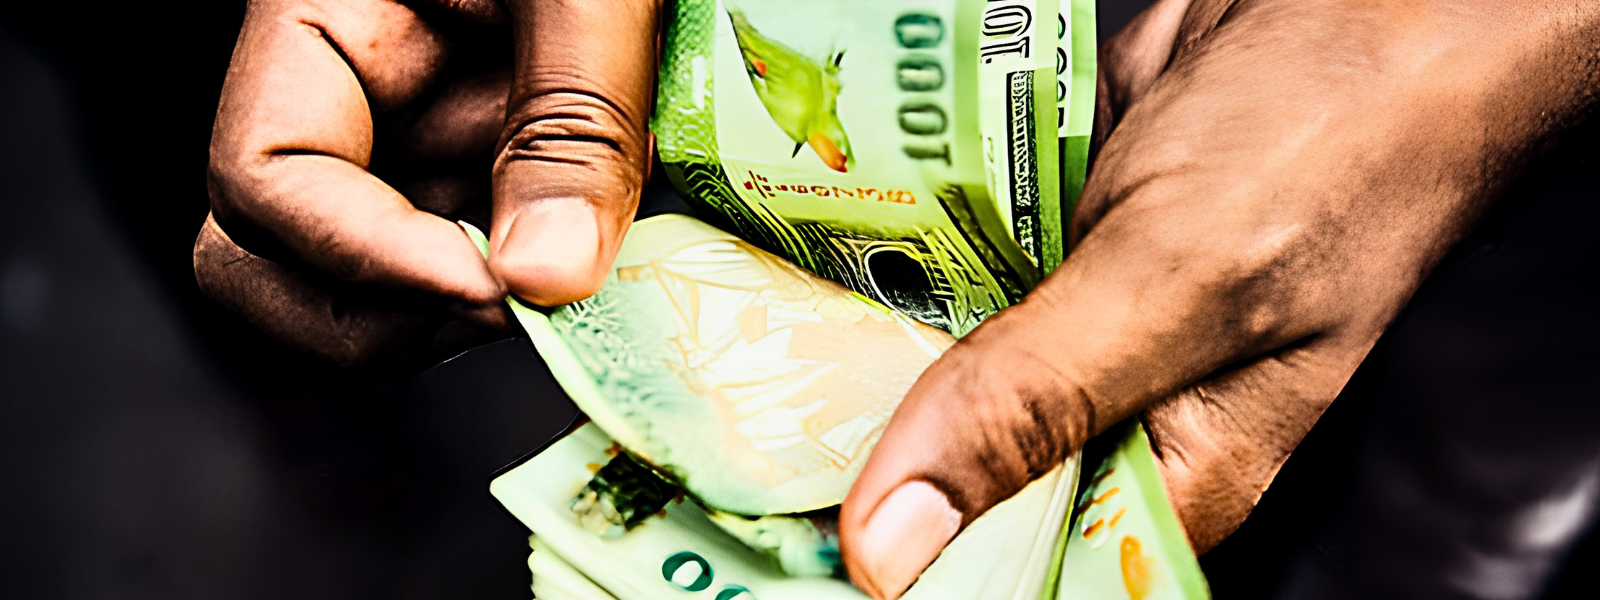
Nearly a decade after 2016, are Sri Lankan households better off? The newly released preliminary results of the Household Income and Expenditure Survey (HIES) 2025 provide an important insight into this question. Despite substantial increases in nominal incomes, the typical Sri Lankan household had less purchasing power in early 2025 than it did nine years earlier, as reported in the 2016 HIES.
More strikingly, the decade has not affected households equally. While real incomes among the poorest households have fallen substantially, those at the upper end of the income distribution have recorded gains that hide the extent of the loss. The widening gap between average and median incomes further suggests that national averages increasingly conceal the experience of the typical household.
Nine Years Without an Improvement in Typical Household Income
According to the Department of Census and Statistics (DCS), average monthly household income increased from Rs. 62,237 in 2016 to Rs. 120,266 in early 2025, an increase of approximately 93%. However, much of this increase reflects inflation rather than improvements in purchasing power.
After adjusting for inflation, real mean household income increased by just 6% over the nine-year period. The experience of the typical household was worse. Real median monthly income fell from Rs. 43,511 in 2016 to Rs. 41,623 in 2025, a 4.3% decline. The comparison between 2016 and 2019 shows that real median household income increased by 7.6%. By early 2025, these gains had disappeared, with real median income falling 11.1% below its 2019 level.
A Lost Decade, but Not for Everyone
The national figures conceal an even more important development: household incomes have followed sharply different trajectories across the income distribution.
After adjusting for inflation, average monthly income among the poorest 20% of households declined from approximately Rs. 14,843 in 2016 to Rs. 12,403 in early 2025, a reduction of 16.4%. In contrast, average real income among the richest 20% increased from approximately Rs. 158,072 to Rs. 184,129, a gain of 16.5%. The divergence is pronounced after 2019, as the COVID-19 pandemic, the economic crisis, and other external shocks produced a decline in real income among the poorest quintile by approximately 19.6%, while income among the richest quintile increased by approximately 6.8% between 2019 and 2025.
Figure: Diverging Real Household Income Trajectories, 2016–2025
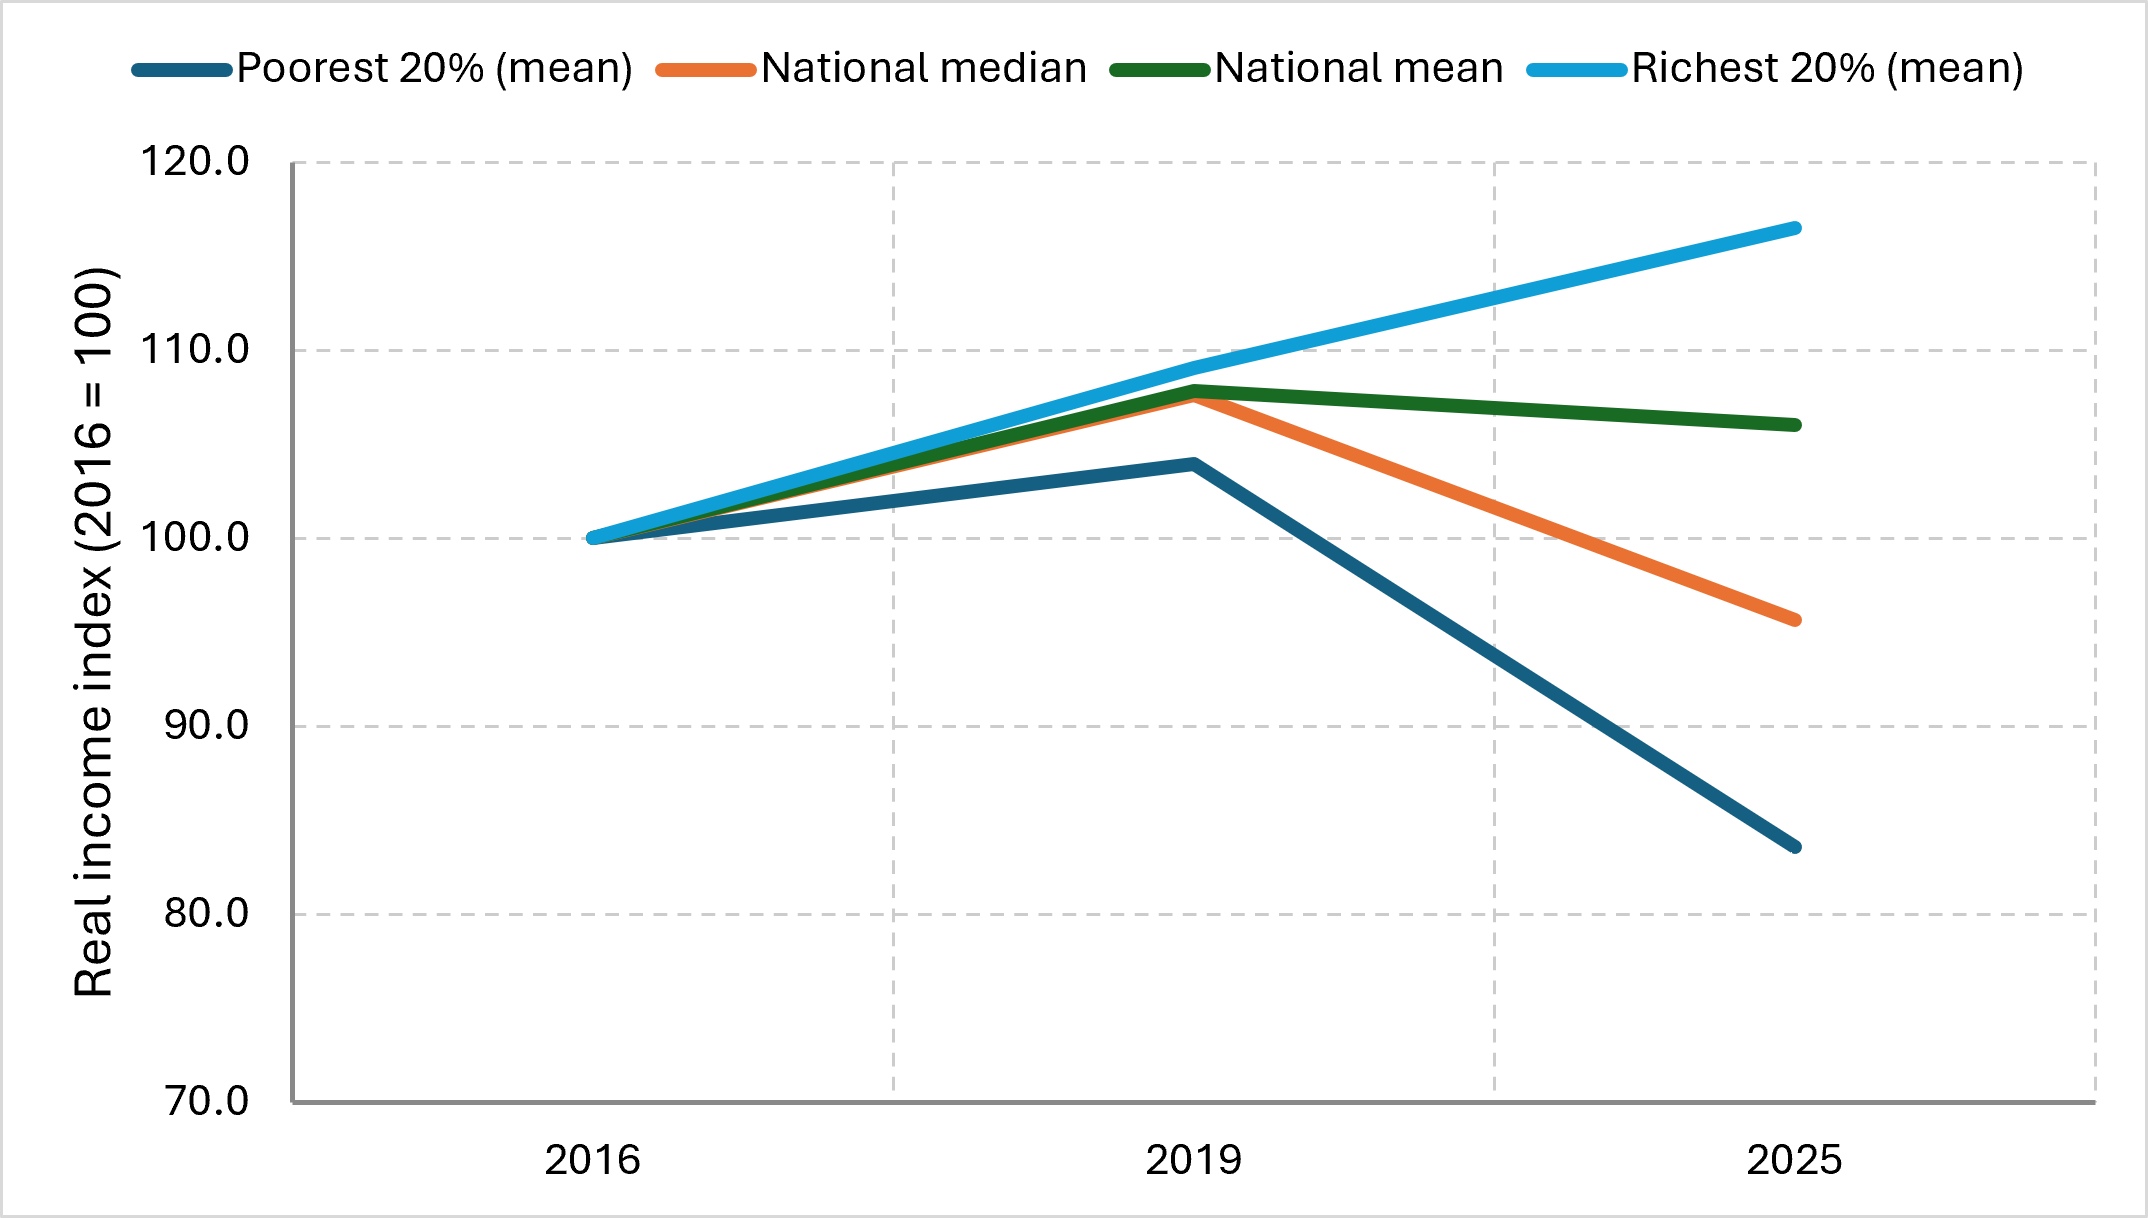
Table: Real Monthly Household Income by Income Group, 2016–2025
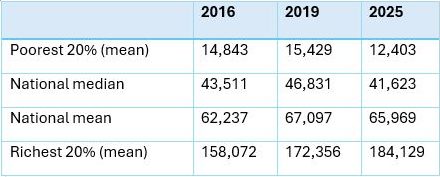
Sources: Department of Census and Statistics, HIES 2016 and 2019 Final Results, and HIES 2025 Preliminary Results. All real income figures are expressed in 2016 prices.
The average income ratio between the richest and poorest quintiles rose from 10.6 in 2016 to 11.2 in 2019 and 14.8 in early 2025. In other words, the households in the richest quintile earned, on average, nearly 15 times as much as those in the poorest quintile in 2025, compared with approximately 11 times in 2016. These suggest the limited improvement in national average income has concentrated at the top end of the distribution while accompanied by a much weaker experience among households at the lower end of the distribution.
The Growing Distance Between the Average and Typical Household
Another revealing finding is the widening difference between mean and median household income. In 2016, average household income was approximately 43% higher than median income. This relationship remained almost unchanged in 2019. However, by early 2025, average income was nearly 59% higher than median income. The divergence reflects their different trajectories; between 2019 and 2025, real mean household income declined by only 1.7%, while real median income fell by 11.1%.
This suggests the mean is influenced by high incomes, while the median represents the household at the midpoint of the income distribution. As a result, improvements among higher-income households can sustain the national average even when the typical household experiences declining purchasing power. Taken together, the widening mean–median gap and growing richest-to-poorest quintile income ratio point towards an increasingly uneven income distribution. However, these indicators are not substitutes for a comprehensive measure of inequality. The 2019 HIES reported an income Gini coefficient of 0.46, compared with 0.45 in 2016. The forthcoming full HIES 2025 results will be important for establishing whether this broader measure has also changed.
Poverty: The Hidden U-Curve
The latest poverty estimates reinforce concerns about the reversal of earlier progress. Sri Lanka’s poverty headcount declined from 16% in 2016 to 14.3% in 2019. However, the preliminary HIES 2025 findings estimate that poverty returned to 16%. The lack of household data between 2019 and 2025 likely hides a peak in poverty that occurred during that period, as the country experienced a plethora of shocks. The World Bank’s revised estimates suggest poverty may have peaked at around 20% during this period.
Figure: Sri Lanka’s Poverty Trajectory: Crisis and Partial Recovery, 2019–2025
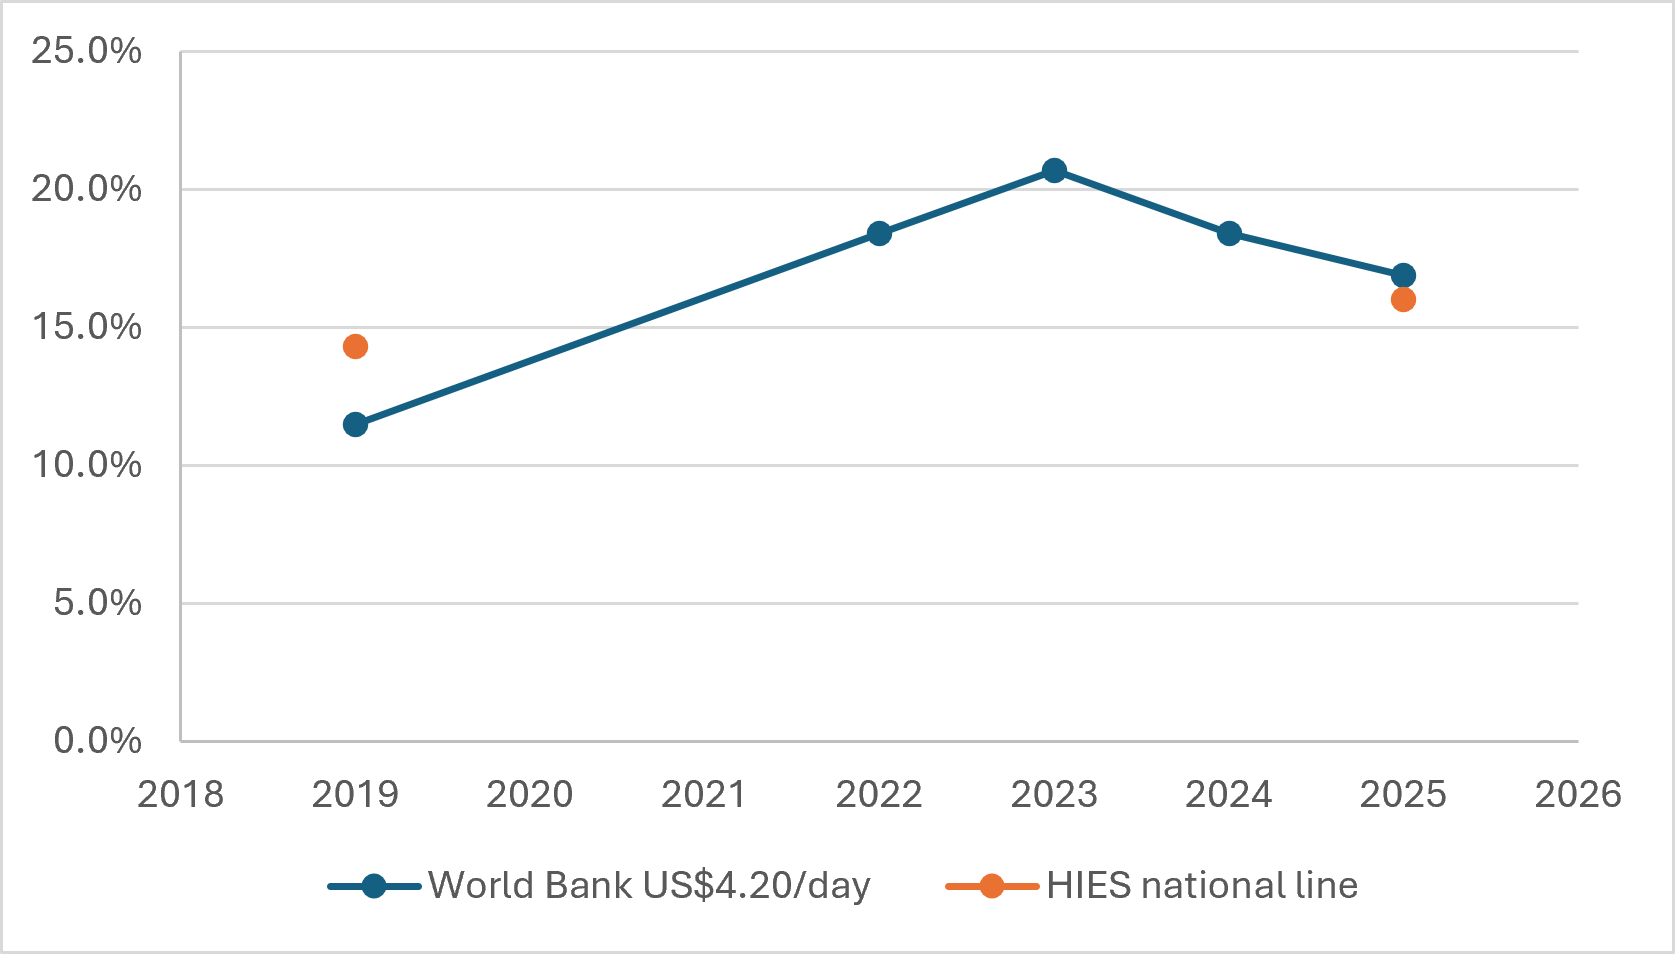
Sources: World Bank (2026), HIES (2019, 2025)
Recovering the Economy Must Mean Recovering Household Incomes
Sri Lanka’s return to economic growth is an important achievement. However, the latest HIES results demonstrate why national economic recovery cannot be assessed solely through aggregate indicators. Nearly a decade after 2016, the typical household has lost purchasing power, poverty reduction has returned to its earlier starting point, and income trajectories have diverged substantially between poorer and richer households.
The key question is no longer simply whether Sri Lanka’s economy is recovering, but whether that recovery is reaching households across the income distribution. A sustainable recovery therefore requires more than restoring economic output to transform it into something durable. It must translate into sustained growth in real household earnings, more productive employment opportunities, and greater resilience among economically vulnerable households.